Midway through Fiscal Year 2021, the VA loan program is on pace to blow past last year's record-setting 1.2 million loans. See which cities are seeing the most growth compared to last year.
The VA loan program set a record for loan guarantees in Fiscal Year 2020. That milestone looks increasingly short-lived.
Midway through Fiscal Year 2021, this historic benefit program is on pace to blow past last year's record-setting 1.2 million loans, according to new data from the Department of Veterans Affairs.
The VA backed more than 817,000 loans in the first half of this fiscal year, an incredible 52% increase from the same span last year. A continued surge in refinance lending is fueling the growth, with VA loan interest rates still hovering near modern-day lows.
Some highlights from the half-year:
- VA refinance loans were up 76% compared to the first half of FY20
- VA purchase loans were up 9.7%
- 31 metro areas saw total VA loans increase 50% or more
- 17 metro areas saw VA refinance loans more than double
- 13 metro areas saw VA purchase loans rise 15% or more
To dig into where Veterans are planting roots or using their benefit to refinance, we took a closer look at VA lending in the nation's metropolitan statistical areas (MSAs). Below, you'll find rankings and tables for:
- The Top 35 cities for total VA loan growth
- The Top 35 cities for VA purchase loan growth
- The Top 35 cities for VA refinance loan growth
We set a minimum loan threshold for each of those categories to weed out big increases in small markets. Those minimums are 1,000 loans for the total and refinance rankings and 500 loans for purchase.
Top 35 Cities for Total VA Loan Growth YoY
| MSA | FY20 Total Loans | FY21 Total Loans | % Difference |
|---|---|---|---|
| Honolulu, HI MSA | 3,662 | 7,131 | 94.73% |
| Washington-Arlington-Alexandria, DC-VA-MD-WV MSA | 18,834 | 36,293 | 92.70% |
| Baltimore-Towson, MD MSA | 6,016 | 10,927 | 81.63% |
| Fayetteville, NC MSA | 3,406 | 6,027 | 76.95% |
| El Paso, TX MSA | 1,740 | 3,058 | 75.75% |
| Virginia Beach-Norfolk-Newport News, VA-NC MSA | 12,626 | 22,062 | 74.73% |
| Montgomery, AL MSA | 1,066 | 1,861 | 74.58% |
| Little Rock-North Little Rock-Conway, AR MSA | 1,542 | 2,673 | 73.35% |
| Huntsville, AL MSA | 2,062 | 3,560 | 72.65% |
| San Antonio, TX MSA | 9,020 | 15,573 | 71.90% |
| New York-Northern New Jersey-Long Island, NY-NJ-PA MSA | 1,530 | 2,630 | 71.62% |
| Anchorage, AK MSA | 1,455 | 2,497 | 70.63% |
| Oxnard-Thousand Oaks-Ventura, CA MSA | 1,338 | 2,283 | 70.63% |
| Albuquerque, NM MSA | 2,262 | 3,797 | 67.86% |
| Tulsa, OK MSA | 1,139 | 1,910 | 67.69% |
| Houston-Sugar Land-Baytown, TX MSA | 6,515 | 10,868 | 66.82% |
| Columbus, GA-AL MSA | 1,520 | 2,525 | 66.12% |
| Savannah, GA MSA | 1,809 | 2,972 | 64.29% |
| Killeen-Temple-Fort Hood, TX MSA | 3,236 | 5,306 | 63.97% |
| St. Louis, MO-IL MSA | 4,375 | 7,149 | 63.41% |
| Austin-Round Rock, TX MSA | 3,114 | 5,077 | 63.04% |
| Omaha-Council Bluffs, NE-IA MSA | 2,220 | 3,588 | 61.62% |
| Philadelphia-Camden-Wilmington, PA-NJ-DE-MD MSA | 3,377 | 5,455 | 61.53% |
| San Diego-Carlsbad-San Marcos, CA MSA | 12,352 | 19,741 | 59.82% |
| Oklahoma City, OK MSA | 2,866 | 4,577 | 59.70% |
| Columbia, SC MSA | 2,800 | 4,467 | 59.54% |
| San Francisco-Oakland-Fremont, CA MSA | 2,312 | 3,680 | 59.17% |
| Fort Walton Beach-Crestview-Destin, FL MSA | 2,460 | 3,880 | 57.72% |
| Augusta-Richmond County, GA-SC MSA | 2,678 | 4,213 | 57.32% |
| Memphis, TN-AR-MS MSA | 1,965 | 3,075 | 56.49% |
| Los Angeles-Long Beach-Santa Ana, CA MSA | 8,080 | 12,568 | 55.54% |
| Raleigh-Cary, NC MSA | 3,143 | 4,873 | 55.04% |
| New Orleans-Metairie-Kenner, LA MSA | 1,411 | 2,181 | 54.57% |
| Jacksonville, FL MSA | 6,395 | 9,8522 | 54.06% |
| Wilmington, NC MSA | 1,455 | 2,240 | 53.95% |
Top 35 Cities for Purchase VA Loan Growth YoY
| MSA | FY20 PurchaseLoans | FY21 Purchase Loans | % Difference |
|---|---|---|---|
| New York-Northern New Jersey-Long Island, NY-NJ-PA MSA | 534 | 743 | 39.14% |
| Anchorage, AK MSA | 606 | 807 | 33.17% |
| Savannah, GA MSA | 809 | 1,043 | 28.92% |
| Virginia Beach-Norfolk-Newport News, VA-NC MSA | 5,273 | 6,752 | 28.05% |
| Fayetteville, NC MSA | 1,734 | 2,204 | 27.10% |
| Columbus, GA-AL MSA | 693 | 874 | 26.12% |
| El Paso, TX MSA | 1,100 | 1,375 | 25.00% |
| Tulsa, OK MSA | 548 | 677 | 23.54% |
| Honolulu, HI MSA | 1,128 | 1,388 | 23.05% |
| New Orleans-Metairie-Kenner, LA MSA | 532 | 643 | 20.86% |
| Washington-Arlington-Alexandria, DC-VA-MD-WV MSA | 5,704 | 6,805 | 19.30% |
| Columbia, SC MSA | 1,182 | 1,404 | 18.78% |
| Riverside-San Bernardino-Ontario, CA MSA | 2,901 | 3,435 | 18.41% |
| Birmingham-Hoover, AL MSA | 606 | 717 | 18.32% |
| Warner Robins, GA MSA | 504 | 588 | 16.67% |
| Clarksville, TN-KY MSA | 1,688 | 1,967 | 1653% |
| Baltimore-Towson, MD MSA | 2,001 | 2,330 | 16.44% |
| St. Louis, MO-IL MSA | 1,575 | 1,832 | 16.32% |
| Albuquerque, NM MSA | 785 | 912 | 16.18% |
| Augusta-Richmond County, GA-SC MSA | 1,291 | 1,499 | 16.11% |
| Charleston-North Charleston, SC MSA | 1,192 | 1,383 | 16.02% |
| Killeen-Temple-Fort Hood, TX MSA | 1,958 | 2,258 | 15.32% |
| Wilmington, NC MSA | 544 | 627 | 15.26% |
| Pittsburgh, PA MSA | 665 | 755 | 13.53% |
| Chicago-Naperville-Joliet, IL-IN-WI MSA | 2,090 | 2,372 | 13.49% |
| Pensacola-Ferry Pass-Brent, FL MSA | 1,568 | 1,769 | 12.82% |
| Las Vegas-Paradise, NV MSA | 2,724 | 3,061 | 12.37% |
| San Antonio, TX MSA | 4,556 | 5,114 | 12.25% |
| Jacksonville, FL MSA | 2,825 | 3,167 | 12.11% |
| Tucson, AZ MSA | 1,341 | 1,495 | 11.48% |
| Sacramento-Arden-Arcade-Roseville, CA MSA | 1,111 | 1,236 | 11.25% |
| Houston-Sugar Land-Baytown, TX MSA | 3,370 | 3,735 | 10.83% |
| Cape Coral-Fort Myers, FL MSA | 518 | 572 | 10.42% |
| Colorado Springs, CO MSA | 3,083 | 3,395 | 10.12% |
| Memphis, TN-AR-MS MSA | 743 | 818 | 10.09% |
Top 35 Cities for Refinance VA Loan Growth YoY
| MSA | FY20 Refinance Loans | FY21 Refinance Loans | % Difference |
|---|---|---|---|
| Killeen-Temple-Fort Hood, TX MSA | 1,278 | 3,048 | 138.50% |
| San Antonio, TX MSA | 4,464 | 10,459 | 134.30% |
| Austin-Round Rock, TX MSA | 1,572 | 3,620 | 130.28% |
| Fayetteville, NC MSA | 1,672 | 3,823 | 128.65% |
| Huntsville, AL MSA | 1,146 | 2,607 | 127.49% |
| Houston-Sugar Land-Baytown, TX MSA | 3,145 | 7,133 | 126.80% |
| Honolulu, HI MSA | 2,534 | 5,743 | 126.64% |
| Washington-Arlington-Alexandria, DC-VA-MD-WV MSA | 13,130 | 29,488 | 124.58% |
| Fort Walton Beach-Crestview-Destin, FL MSA | 1,151 | 2,540 | 120.68% |
| Oklahoma City, OK MSA | 1,376 | 2,970 | 115.84% |
| Baltimore-Towson, MD MSA | 4,015 | 8,597 | 114.12% |
| Virginia Beach-Norfolk-Newport News, VA-NC MSA | 7,353 | 15,310 | 108.21% |
| Omaha-Council Bluffs, NE-IA MSA | 1,348 | 2,694 | 99.85% |
| Augusta-Richmond County, GA-SC MSA | 1,387 | 2,714 | 95.67% |
| Albuquerque, NM MSA | 1,477 | 2,885 | 95.33% |
| Savannah, GA MSA | 1,000 | 1,929 | 92.90% |
| Pensacola-Ferry Pass-Brent, FL MSA | 1,592 | 3,066 | 92.59% |
| Dallas-Fort Worth-Arlington, TX MSA | 5,191 | 9,984 | 92.33% |
| St. Louis, MO-IL MSA | 2,800 | 5,317 | 89.89% |
| Philadelphia-Camden-Wilmington, PA-NJ-DE-MD MSA | 2,253 | 4,271 | 89.57% |
| Columbia, SC MSA | 1,618 | 3,063 | 89.31% |
| Oxnard-Thousand Oaks-Ventura, CA MSA | 1,035 | 1,948 | 88.21% |
| Jacksonville, FL MSA | 3,570 | 6,685 | 87.25% |
| Memphis, TN-AR-MS MSA | 1,222 | 2,257 | 84.70% |
| Clarksville, TN-KY MSA | 1,333 | 2,446 | 83.50% |
| Raleigh-Cary, NC MSA | 2,022 | 3,663 | 81.16% |
| Pittsburgh, PA MSA | 1,026 | 1,813 | 76.71% |
| San Diego-Carlsbad-San Marcos, CA MSA | 9,360 | 16,504 | 76.32% |
| Kansas City, MO-KS MSA | 2,396 | 4,216 | 75.96% |
| Louisville/Jefferson County, KY-IN MSA | 1,479 | 2,591 | 75.19% |
| Tucson, AZ MSA | 2,680 | 4,681 | 74.66% |
| Birmingham-Hoover, AL MSA | 1,029 | 1,788 | 73.76% |
| Tampa-St. Petersburg-Clearwater, FL | 5,105 | 8,842 | 73.20% |
| Charleston-North Charleston, SC MSA | 1,949 | 3,364 | 72.60% |
| Bakersfield, CA MSA | 1,055 | 1,810 | 71.56% |

Related Posts
-
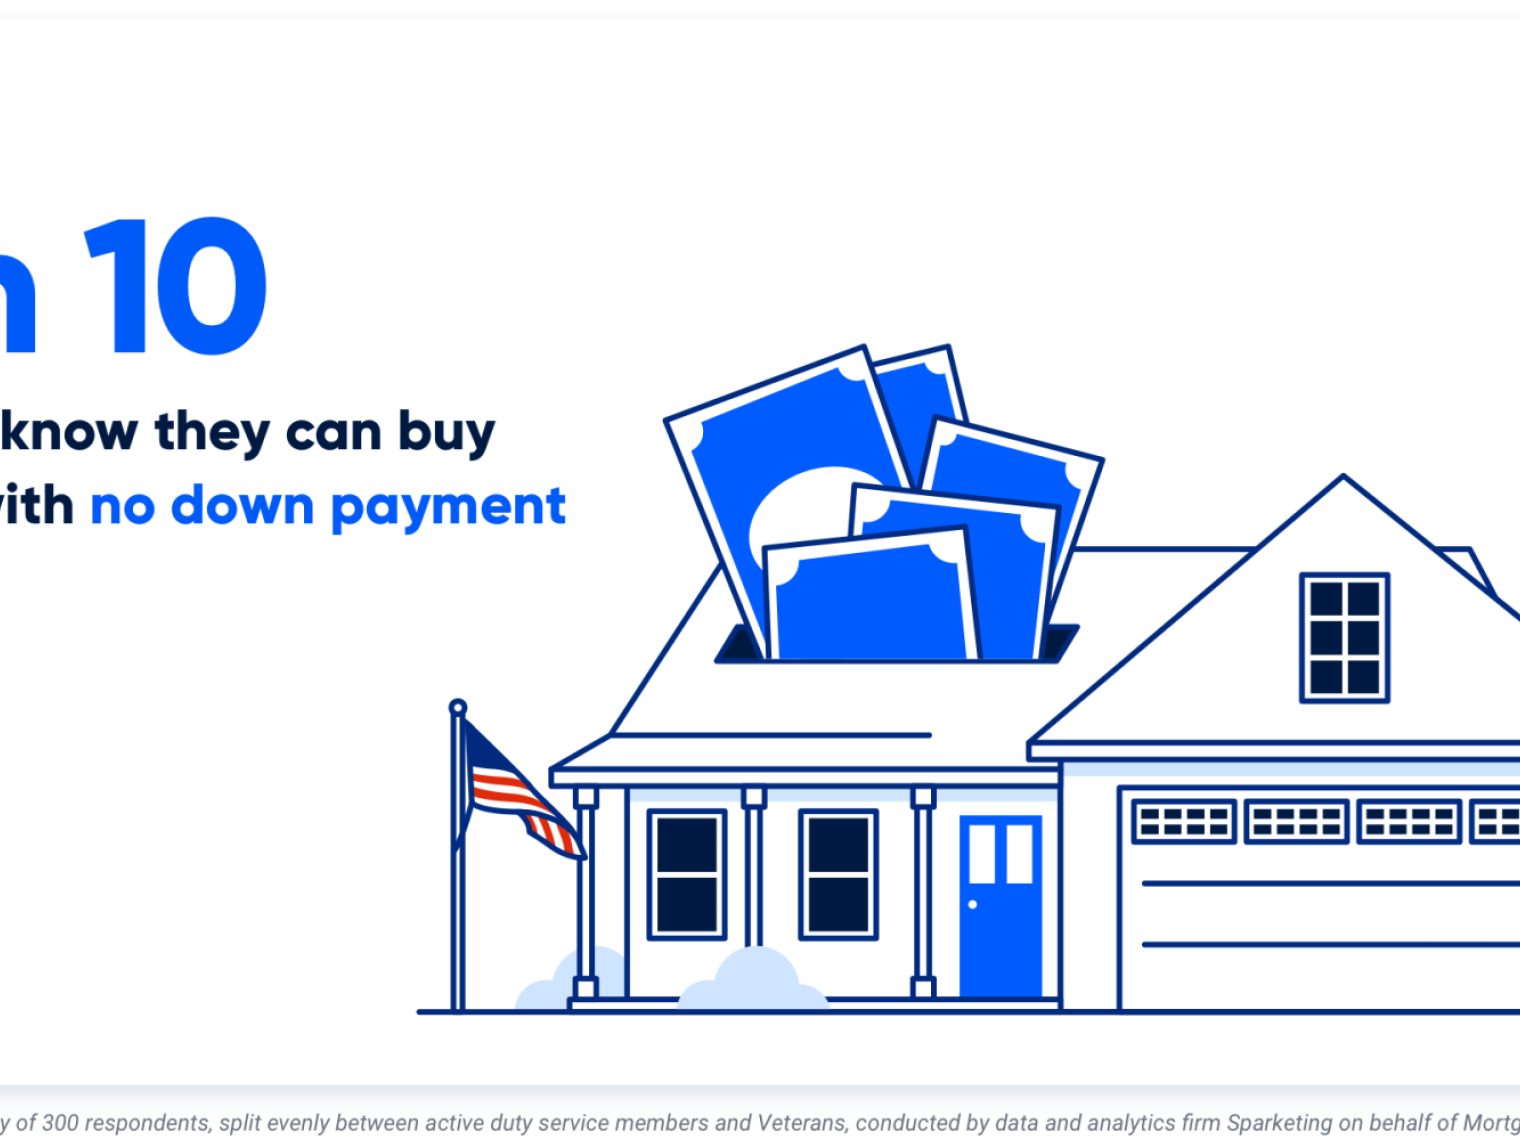 VA Loan Down Payment RequirementsVA loans have no down payment requirements as long as the Veteran has full entitlement, but only 3-in-10 Veterans know they can buy a home loan with zero down payment. Here’s what Veterans need to know about VA loan down payment requirements.
 -
 5 Most Common VA Loan Myths BustedVA loan myths confuse and deter many VA loan borrowers. Here we debunk 5 of the most common VA loan myths so that you can borrow with confidence.


