Veterans United in
Philadelphia-Camden-Wilmington, PA
in the PA, NJ, DE, MD metro area
The Philadelphia housing market in March has strengthened compared to last year with the median home price around $356,425 — up 1.8% from last year. Homes for sale in Philadelphia* now spend an average of 53 days on the market, and nearly 25% sell below asking price, giving buyers more negotiating power.
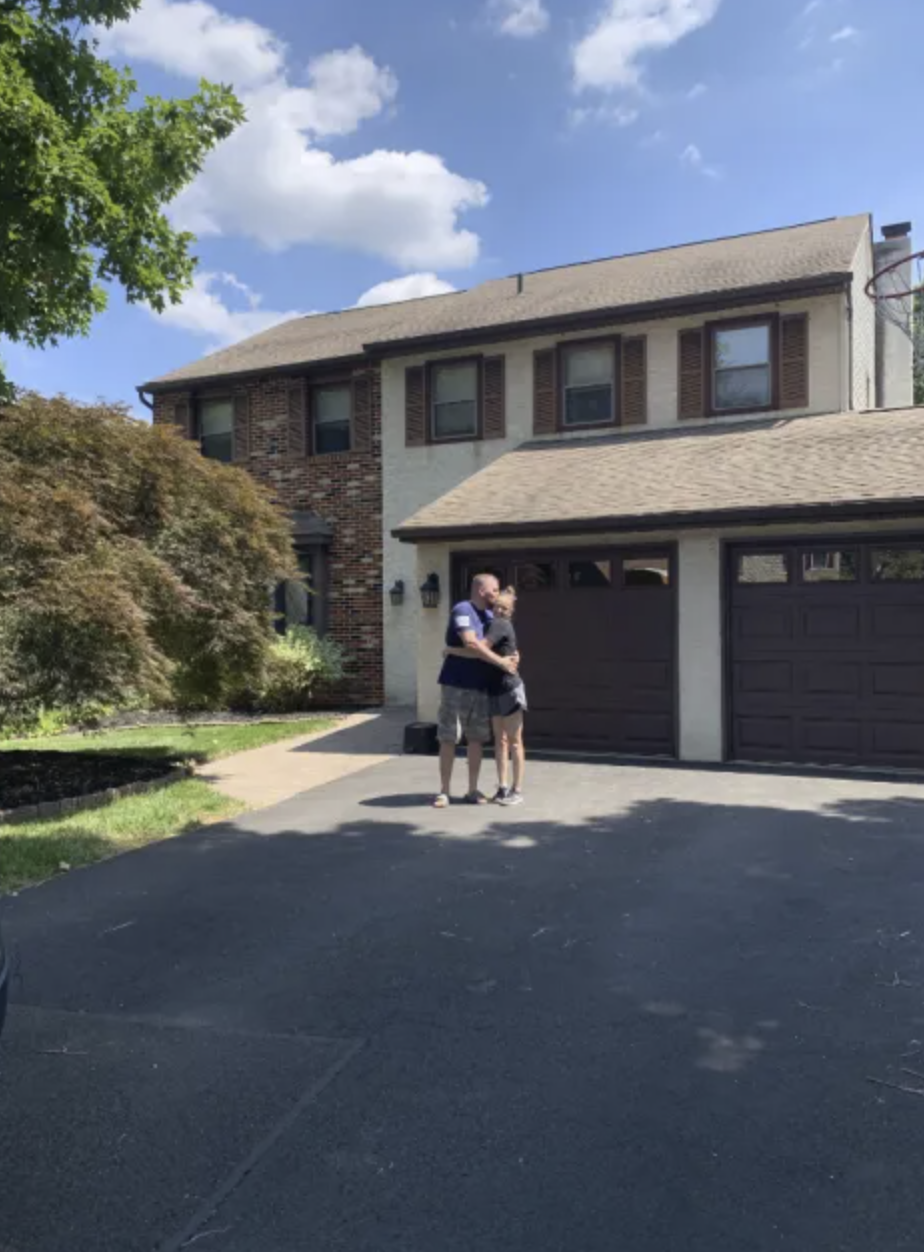
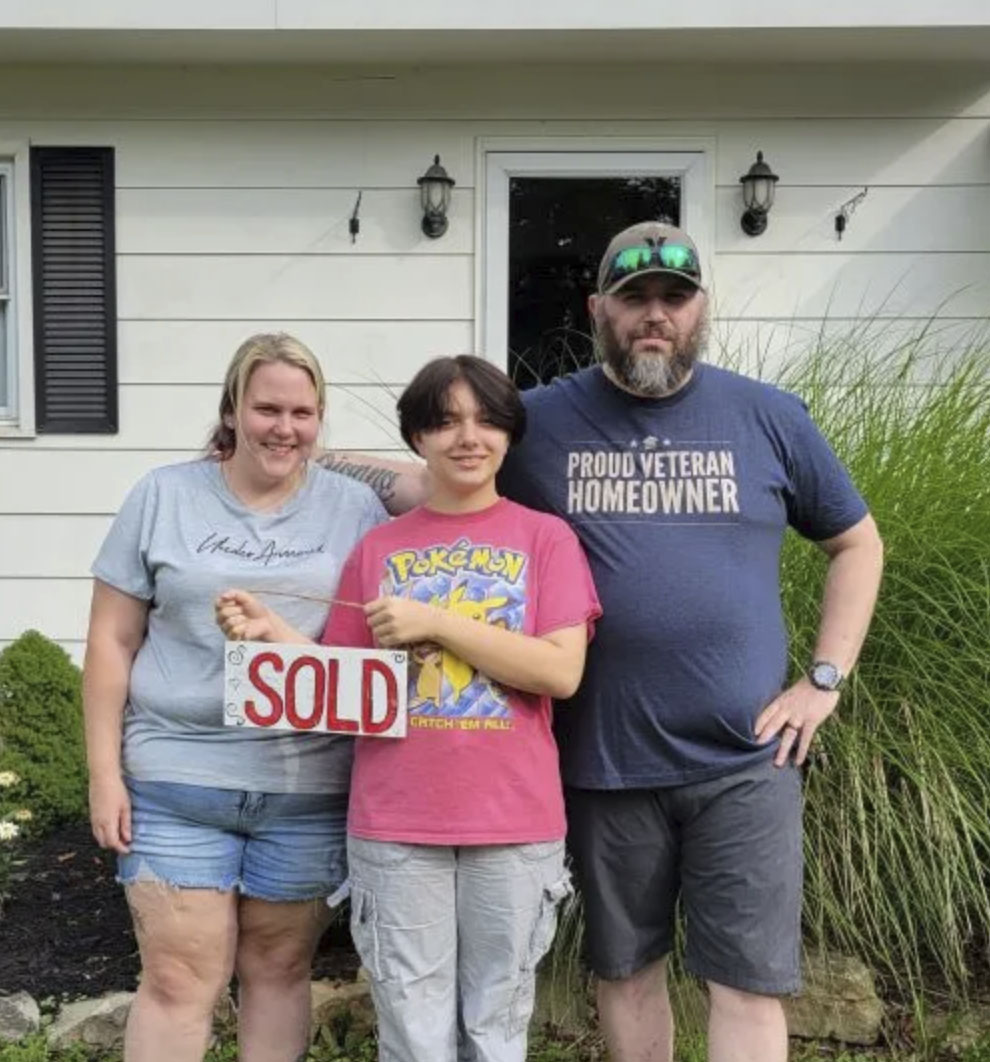
Just a few of the 782,740 Veterans we've helped get into homes.
6,361 Veterans in the Philadelphia-Camden-Wilmington, PA-NJ-DE-MD area alone!
Based on Veterans United and Veterans United Realty's internal data.
Brian W. | U.S. Marine Corps
Ronald B. | U.S. Army
David P. | U.S. Marine Corps
Donova B. | U.S. Army
Dormain V. | U.S. Navy
William E. | U.S. Army
Hames M. | U.S. Military
Philadelphia Metro Housing Market in March 2026
Median Days on Market
53 days
Homes are staying on the market 17.19% fewer days since last month.
Average Listing Price
$521,722
Average home prices are up 1.24% since last month.
Active Listings
9,095 homes
Number of houses on the market are down 4.09% since last month.
Homes in the Philadelphia region sell at a moderate pace.
25% of listings reduced price last month.
4,872
New listings
Up 3.7% from last month
9,095
Active listings
Down 4.1% from last month
VA Loan Market Share
3.5% of originations last year were VA loans.
951
Sold last year
1/29
Were VA loans
Philadelphia Area
Own vs Rent Trends
A higher share of owner-occupied homes often reflects stronger long-term ties to the community, since homeowners are more likely to stay in one place and invest in their neighborhoods. By contrast, areas with a larger renter population may be more transient, offering flexibility but sometimes less stability in housing markets.
It could also be an indication of market health, as affordable markets often have higher owner-occupancy rates.
The home listing price-to-income ratio in the Philadelphia area is 4.1
The ratio compares how expensive homes are in Philadelphia relative to household income. A higher ratio means homes cost more compared to what people earn.
A healthy price-to-income ratio is generally around 3 times your household's annual income (or less), but higher ratios can be sustainable depending on your rate, DTI, and more.
Median Home Prices by Neighborhood in the Philadelphia Region
This section breaks down median home prices by neighborhood. Use these insights to see where housing costs trend higher or lower, and to better understand the market at the zip code level.
The Philadelphia metro median income is $86,867.
Explore Philadelphia Area Neighborhoods
See how median home prices in individual Philadelphia neighborhoods compare to the overall metro median.
View this chart to learn about the median listing price and the number of active listings in Philadelphia over time.
Month
Apr 2022
May 2022
Jun 2022
Jul 2022
Aug 2022
Sep 2022
Oct 2022
Nov 2022
Dec 2022
Jan 2023
Feb 2023
Mar 2023
Apr 2023
May 2023
Jun 2023
Jul 2023
Aug 2023
Sep 2023
Oct 2023
Nov 2023
Dec 2023
Jan 2024
Feb 2024
Mar 2024
Apr 2024
May 2024
Jun 2024
Jul 2024
Aug 2024
Sep 2024
Oct 2024
Nov 2024
Dec 2024
Jan 2025
Feb 2025
Mar 2025
Apr 2025
May 2025
Jun 2025
Jul 2025
Aug 2025
Sep 2025
Oct 2025
Nov 2025
Dec 2025
Jan 2026
Feb 2026
Listing Price
$325,000
$339,900
$347,450
$345,000
$337,745
$335,000
$335,000
$329,950
$320,000
$319,450
$322,450
$327,450
$339,200
$349,450
$354,950
$350,000
$350,000
$350,000
$350,000
$349,900
$340,000
$337,375
$339,950
$349,999
$369,950
$382,076
$395,000
$389,950
$382,000
$379,450
$376,500
$372,500
$358,075
$352,000
$350,000
$359,000
$375,000
$385,000
$387,450
$384,950
$380,000
$384,900
$379,973
$370,000
$359,950
$350,000
$356,425
Month
Apr 2022
May 2022
Jun 2022
Jul 2022
Aug 2022
Sep 2022
Oct 2022
Nov 2022
Dec 2022
Jan 2023
Feb 2023
Mar 2023
Apr 2023
May 2023
Jun 2023
Jul 2023
Aug 2023
Sep 2023
Oct 2023
Nov 2023
Dec 2023
Jan 2024
Feb 2024
Mar 2024
Apr 2024
May 2024
Jun 2024
Jul 2024
Aug 2024
Sep 2024
Oct 2024
Nov 2024
Dec 2024
Jan 2025
Feb 2025
Mar 2025
Apr 2025
May 2025
Jun 2025
Jul 2025
Aug 2025
Sep 2025
Oct 2025
Nov 2025
Dec 2025
Jan 2026
Feb 2026
Active Listings
7,346
8,575
9,689
10,816
10,805
10,767
11,182
11,024
9,772
8,896
8,086
7,967
8,053
8,047
8,318
8,348
8,555
9,092
9,607
9,708
8,879
7,895
7,622
7,863
8,315
8,723
9,215
9,461
9,659
10,378
10,898
10,897
9,447
8,801
8,732
9,279
9,827
10,711
11,057
11,227
11,521
11,991
12,052
11,580
10,166
9,482
9,095
Median Days on Market
Days on Market
This chart shows the median days on market for active listings over time. In other words: how quickly homes move in the market. A declining rate means rising competition among buyers, while an increase means listings are sitting longer.
Month
Apr 2022
May 2022
Jun 2022
Jul 2022
Aug 2022
Sep 2022
Oct 2022
Nov 2022
Dec 2022
Jan 2023
Feb 2023
Mar 2023
Apr 2023
May 2023
Jun 2023
Jul 2023
Aug 2023
Sep 2023
Oct 2023
Nov 2023
Dec 2023
Jan 2024
Feb 2024
Mar 2024
Apr 2024
May 2024
Jun 2024
Jul 2024
Aug 2024
Sep 2024
Oct 2024
Nov 2024
Dec 2024
Jan 2025
Feb 2025
Mar 2025
Apr 2025
May 2025
Jun 2025
Jul 2025
Aug 2025
Sep 2025
Oct 2025
Nov 2025
Dec 2025
Jan 2026
Feb 2026
Median Days on Market
36
34
37
40
46
51
51
55
66
73
67
53
46
44
45
45
45
45
44
46
56
66
59
43
40
34
38
41
44
45
43
47
57
63
52
39
35
35
41
44
44
45
43
47
58
64
53
Market Hotness Score
Market Hotness
Based on Realtor.com's Market Hotness Index, this measure reflects how competitive the housing market is by comparing buyer demand with available inventory. Rising hotness scores point to more competition, while declining scores signal cooling conditions.
Month
Apr 2022
May 2022
Jun 2022
Jul 2022
Aug 2022
Sep 2022
Oct 2022
Nov 2022
Dec 2022
Jan 2023
Feb 2023
Mar 2023
Apr 2023
May 2023
Jun 2023
Jul 2023
Aug 2023
Sep 2023
Oct 2023
Nov 2023
Dec 2023
Jan 2024
Feb 2024
Mar 2024
Apr 2024
May 2024
Jun 2024
Jul 2024
Aug 2024
Sep 2024
Oct 2024
Nov 2024
Dec 2024
Jan 2025
Feb 2025
Mar 2025
Apr 2025
May 2025
Jun 2025
Jul 2025
Aug 2025
Sep 2025
Oct 2025
Nov 2025
Dec 2025
Jan 2026
Feb 2026
Hotness Score
32.9431
34.1137
30.602
34.2809
38.796
40.1338
49.4983
51.1706
54.0134
55.3512
45.1505
46.99
43.4783
39.4649
39.2977
42.8094
47.8261
51.505
57.5251
62.5418
61.204
56.1873
52.6756
58.5284
58.5284
59.3645
56.689
56.1873
62.3746
64.5485
73.0769
74.2475
72.5753
71.7391
70.7358
75.0836
75.0836
74.5819
68.8963
70.4013
72.5753
73.7458
76.5886
75.9197
76.087
73.4114
70.4013
Pending Homes-for-Sale %
Percentage of Homes Sold per Month
This chart shows the percentage of homes that sold each month, highlighting buyer demand and long-term market trends. In most markets, around 20% of listings selling each month is considered balanced. Higher percentages point to a strong sellers' market, while lower percentages indicate more favorable conditions for buyers.
Largest overall VA lender (purchase and refinance) for seven of the last ten years.
More VA purchase loans than any other lender for the past 10 consecutive years
Over the last six years, Veterans United made more VA purchase loans than USAA, Navy Federal Credit Union, Rocket Mortgage, Wells Fargo and Freedom Mortgage combined.
Most Veterans don't realize how little money it can take to buy a home. Many think it's out of reach, especially with lower approval amounts, but it's possible. Helping them understand options like seller concessions is one of the most rewarding parts of the job.
Paul D.Veterans United Network Realty Agent
In the Philadelphia market, VA buyers often see the most success on homes priced between $200,000 and $400,000, especially those that have been listed for 20 days or more. That's when you're more likely to negotiate and secure favorable terms.
Alexander S.Veterans United Network Realty Agent
In northeast Pennsylvania markets like Bushkill, Hawley, and Scranton/Wilkes-Barre, homes often receive multiple offers and can go under contract in just a day or two. VA buyers who are preapproved and prepared to act quickly are in the best position to compete.
Vernon W.Veterans United Network Realty Agent
1-800-985-5723 | 1512 Heriford Road, Columbia, MO 65202. Not affiliated with any government agency including the VA. Missouri Licensed Real Estate Brokerage; for license information, visit VeteransUnitedRealty.com. Equal Housing Opportunity.
Start Your VA Loan With Veterans United
Not sure where to begin? Whether you're stationed nearby or planning to move near Philadelphia, we’ll help you understand what to expect.
Great team worked tirelessly to get me approved as fast as possible!! Helped make a great memory!!
James L. | Navy
Verified Customer
The staff was easy to work with Justin team was amazing and easy to work with
Robert S. | Navy
Verified Customer
Our team at Veterans United made purchasing our first home smooth and straightforward! The support, communication, and customer service exceeded our expectations! Thank you Veterans United!!
Brian W. | Marine Corps
Verified Customer
What a great experience. From beginning to end. Couple bumps in the road due to home appraisal nothing to do with Veterans United. But i can tell you they came up with another way. Felt the fees were kind of high but otherwise very happy with their performance.
Richard H. | Army
Verified Customer
Team I worked with was outstanding.They explained every step of the mortgage process with detail.They had all the answers for all my questions ti put me at ease.
James I. | Marine Corps
Verified Customer
Everyone was so helpful and available when I had questions, lots of questions.
Paula M. | Air Force
Verified Customer
Veterans united was a big help. Help me with everything I didn't know. We can't be any happier with our new home.
Donovan B. | Army
Verified Customer
Veterens United was simply Amazing! From time I filled out application to closing! John and Samantha helped me each step of the way so it never felt overwhelming.
Timothy S. | Navy
Verified Customer
jeff and his team are awesome!!! highly recommend
Larry G. | Army
Verified Customer
Josh is a fantastic loan officer. His kindness toward me was unsurpassed. He is extremely knowledgeable and has made the transaction to my new home. Very easy. I would highly recommend him to deal with any customer anytime. MAP.
Mark P. | Navy
Verified Customer
Stephen and his team provided an outstanding home buying experience. This whole process can be overwhelming at times, but they were gracious and helpful every step of the way. The myvu portal provided a streamlined and organized access point for everything involved with the loan process. With a docu...
James M. |
Verified Customer
The best service you can get. Best team; super professional and always beats the competitor.
*Unless stated otherwise, data for the metro refers to the CBSA ("Core-Based Statistical Area"), the defined geography that makes up the surrounding metropolitan and micropolitan areas.
We Use Cookies and Pixels
This website uses cookies, pixels, and similar tracking technologies to improve site functionality,
as well as for analytics and advertising.
By continuing, you agree to our use of cookies, pixels, and similar tracking technologies.
Learn more about our use of tracking technologies in our
privacy policy.
Estimate Accuracy Rating
Start Here: 0% Down VA Home Loans
3,705
Veterans started their online quote today.
Cookies and Related Technologies
Notice of Right to Opt-Out of Sale/Sharing
Your Privacy Choices
You can always choose to opt out of us sharing your name, email address, or other personal information with third parties for advertising purposes.
Cookies are small text files that store bits of information (such as usernames or preferences) to help recognize your device. We use cookies to keep our site running properly and to enhance your experience.
You can manage your cookie preferences at any time, including turning off advertising cookies. Please note that disabling some cookies may impact your experience on the site. Essential cookies, which are necessary for basic site functions, cannot be turned off.
These are required for the website to work correctly. They support core features like secure login and saving your progress through forms or applications.
Advertising Cookies
These cookies may share data with advertising partners in order to: